
Configuring Kibana
- Kibana confugrations are stored in /etc/kibana/kibana.yml
- Configuration settings in Yaml
- server.port: This specifies on which port kibana receives requests. Defaults to 5601
- server.host: Ip address to which kibana server will bind. defaults to localhost
- elasticsearch.url: url of elastic search instace to use to create visualizations/query
- Refer Here for all the settings on kibana.yaml
Lets use Sample data to understand kibana
- Select Sample data


To experiment with out of box data
- Download logs from here. These logs are for learning and experimentation purposes
- Logs are generated by Apache server time period is May 2014 to June 2014.
- To import these logs into elastic search lets create a logstash configuration
input
{
    file {
        path => ["/home/ubuntu/mylogs/logs"]
        start_position => "beginning"
        sincedb_path   => "NULL"
    }
}
filter{
    grok {
        match => {
            "message" => "%{COMBINEDAPACHELOG}"
        }
    }
    mutate
    {
        convert => { "bytes" => "integer" }
    }
    date{
        match => [ "timestamp", "dd/MMM/YYYY:HH:mm:ss Z"]
        locale => en
        remove_field => "timestamp"
    }
    geoip {
        source => "clientip"
    }
    useragent {
        source => "agent"
        target => "useragent"
    }
}
output {
    stdout {
        codec => dots
    }
    elasticsearch {
        hosts => ["172.31.0.9:9200"]
    }
}
- Now start logstash by using command
./logstash -f dump.conf
- Now we can check indexes in kibana

User Interaction in Kibana
- Interactions in kibana is a four step process
- Configure/Manage Index
- Discover Data
- Create Visualizations
- Create Dashboards

Configuring/Managing Index
- This is acheived by configuring index pattern.
- Two types of Indexes exist in Elastic Search
- Time-series index:
- This index will have all the data which has correlation with timestamp.
- Regular index
- If the index doesn’t contain time stamp & there is no correlation with time, then the data is called as regular data.
- Time-series index:
- As a first step we need to create index pattern in which we select a indexes where we want to discover data
- To create index pattern Refer Here


Discover
- The Discover page helps you to interactively explore data. It allows to perform search queries, filter search results, view document data

- Query data: The Query bar accepts 3 kinds of queries
- Elastic search query string/Lucene query
- A full json-based Elastic query DSL Refer Here
- Kibana Query Language Refer Here
Visualize
- Thi page helps to create visualization in the form of graphs, charts and tables.
Dashboards
- Dashboards help you bring different visualizations into a single page & share this dashboard across websites/monitors.
Practical Implementation
- I have 3 servers with mysql, apache & tomcat installed
- I have elastic stack up & running
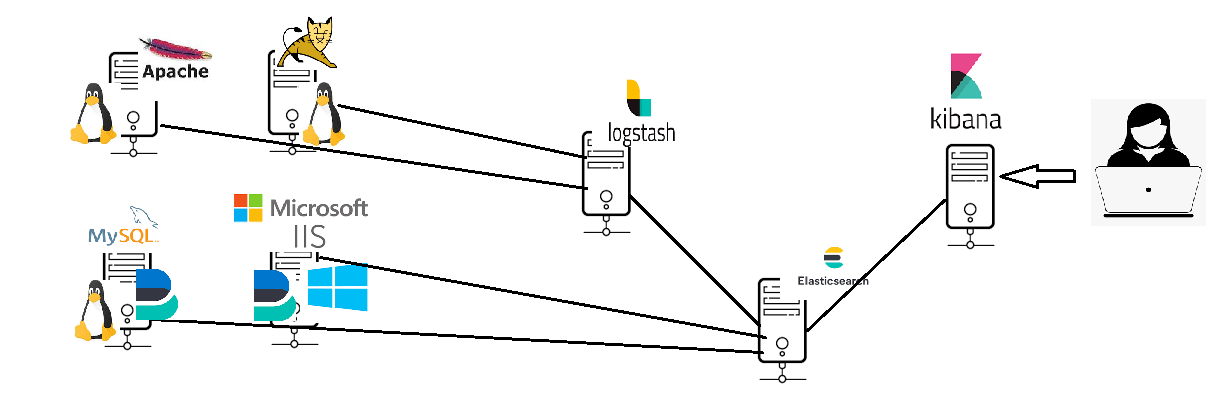
- So lets install filebeats and send logs to elastic stack directly